
The best indicator of a future recession is not perfect, and doesn’t provide an exact time or date, but economists have found that an inverted yield curve can be a warning sign of a downturn to come.
A what? The yield curve is a map of the yield of bonds from very short term—one month, three months, six months, 1, 2, 3, 5, 7, 10 and all the way out to 30 years. A normal curve is sloped upward—for obvious reasons. The longer the maturity of the bond, the more the borrower should have to pay to compensate you for the risks of inflation and interest rate movements. The 3-month bill should pay at least incrementally less than the 6-month maturity, and on up the maturity range.
Deviations from this obvious hierarchy are rare—as it turns out, just about as rare as recessions. Since 1955, long-term bonds yielded less than short-term ones before every single U.S. recession. Nobody knows exactly why a spate of market illogic should be followed by economic pain; there are theories, but the cause/effect is uncertain.
Unfortunately, the inversions in the past have occurred anywhere from 6 months to 24 months before the actual recession, so this is not exactly a precise timing mechanism. But perhaps we should consider the next yield inversion as a time to buckle our seat belts on the investment roller coaster.
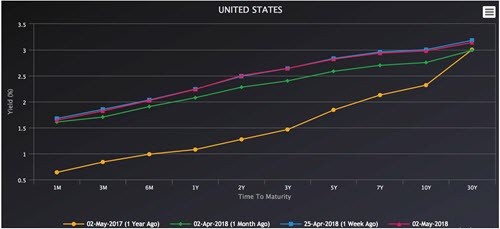
So where are we now? The chart shows the current yield curve (red) compared with a week ago (blue), a month ago (green) and a year ago (orange). As you can see, the curve has flattened in the past 12 month, not to inversion, but certainly a narrower spread. If you want to watch to see if there is further flattening, here’s one website that tracks the curve in real time.
Stay Diversified, Stay Your Course!